AXFJ: In Search of a Low.


Anatomy of a Trade: Let's review what was Evident; Actionable & How would one 'manage' the previously noted Aggressive Short Trade yet with defined Stop/Loss.
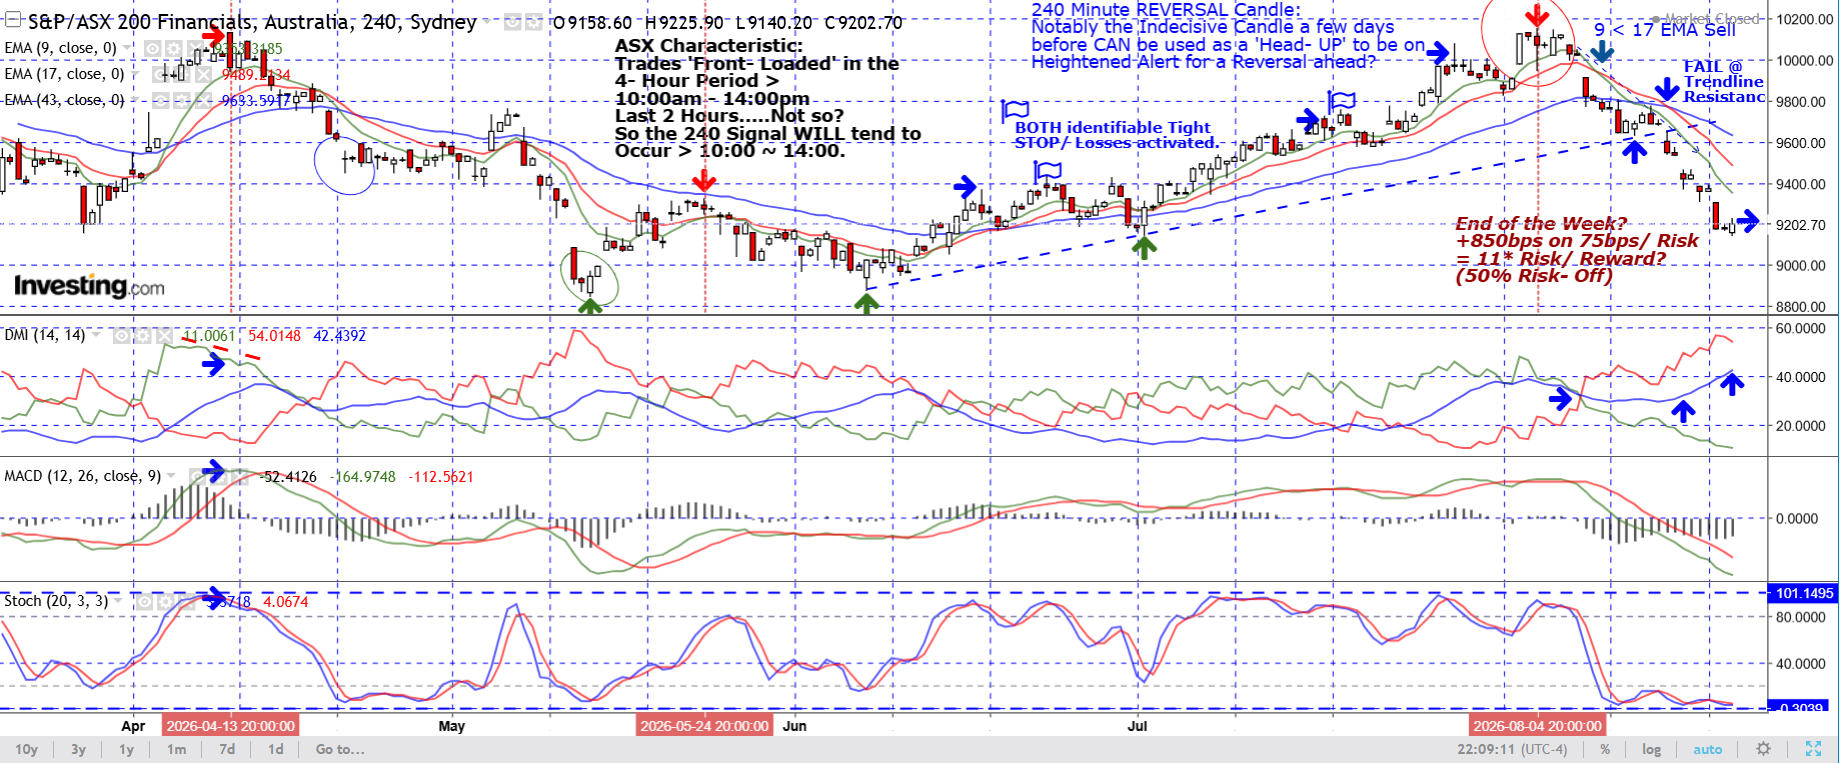
- Signal: 240 Minute Reversal = Actionable Signal (RED Arrow 04/ 08) >>> A Large Price Range Reversal (RED) Candle @ 10,150.
- The interim Support circa a 38.2 % Retrace (viewed constructively) & forming a Third Point of Support with the immediate 'Bounce' off of it.
- Breach of said Support Line (see previous Post/ Email 'corrected chart.') THIS inferred that the Sell- Off was 'Serious Business' & with NO Price Signal (240m) to signal an Exit from the Short.....then 'Let the Position Run.'
- US Banking Index Losses reinforced the Losses as the Aussie Banks are NEVER too far away from the US Philly FED Banking Index developments.
- Domestic Economic news (Australian Mortgage Demand) was THE Catalyst BUT the Reversal (240m) Signal presaged it without 'knowing' this......?
- Initial Positioning: The Reversal WAS The Signal for a Tactical Short Trade.
- Plan the Trade | Trade the Plan = Sell 33% of your Risk Position (X) @ the Close Price of the 240 Minute Reversal Candle (10,073) with 'The Plan' to Sell (if the chance occurs) another 67% of Total Risk Position @/ below High Price (10,150)...aka: 10,125 (?) & 10,140 (?) Average Short Price = 10,113.
- STOP/ Loss: THIS is a Function of Trade Risk Profile.....SO; it's a Tactical Trade & as such; LIMIT Losses: 0.75% (?) whilst expecting to capture > 4.25% GIVEN that The Plan was a Retrace back to the 38.2% @ 9,665 (425/75 = 5+*)
- Planned EXIT Level was 9,665. Why didn't one EXIT? A: There was NO Clear & Evident Price Signal; simply a 'bounce' (which one old timer from up Byron Bay way always opined....Respecting a Technical Level 1st Time signals that there's MORE to Run in the ABSENCE of a Price Reversal Confirmation)
- Now what? We AWAIT (patience) a Signal that identifies a Potential Bottom & Termination of the Decline. OR we exercise Proprietary P/L considerations.
- How so? Trending Lower ADX > 20 & Rising + DMIs are in Sell Mode (RED > Green) instructs us to 'Sit Tight.' Need to Witness an Identifiable Low.
- Stop- Loss Management? Tactical Trades CAN follow a Japanese Rule. "Should you get on the Wrong Train, get OFF @ the Nearest Station; the Longer it takes you to get OFF, the MORE expensive the Return Trip will BE."
- Translation: Find an Edge to lean UP against on the Stop- Loss. EG: Reversal High Trade + Your Risk Tolerance [=f (P/L Expectation) = f (What's the Field Position of the Overall Market (Over- Bought, Diverging Momentum Studies)]
SO here's todays Chart: Apologies as it's a Busy Chart.....Lots to garner from & better understand that Risk Management IS The Game once a Signal witnessed.
Additional Note: Initial Assumption of 'X' Sized Risk Position could have been added to dependent upon unfolding Price Action & Initial Positioning Advantage.
AKA: If you're in a Strong Position AND identifiable Risk Management (S/Loss) Levels present themselves (THAT Rising Trend Line of Support [3 Points] becoming overhead Resistance an uncommon BUT Highly useful Trading Advantage to exercise a Higher Degree of Aggressive Exposure) but with DEFINED Risk Profile (Tight & Identifiable Trailing Stop/ Loss @ above the Trend Line of (now) Resistance.) SO one could have added more Size with a Tight Stop/ Loss.
[Plan the Trade | Trade the Plan]